JETNET Releases June 2019 and First Six Months of 2019 Pre-Owned Business Jet, Business Turboprop, Helicopter, and Commercial Airliner Market Information
JETNET LLC has released June and the first six months of 2019 results for the pre-owned business jet, business turboprop, helicopter and commercial airliner markets.
Market Summary
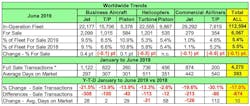
Highlighted in Table A are key worldwide trends across all aircraft market segments, comparing June 2019 to June 2018. “Fleet For-Sale” percentages for all sectors were mixed in the June comparisons. June 2019 is on the rise for “For Sale” percentage (9.5 percent) for business jets.
TRENDS: Except for Piston Helicopters, all aircraft sectors reported double-digit percentage decreases in full sale transactions in the first six months of 2019 versus 2018.
For the first six months of 2019, Pre-owned Business Jets are showing a 21.5 percent decrease in pre-owned sale transactions, and are taking more time to sell (28 days) than last year. Business turboprops saw a 13.9 percent decrease in sale transactions, while taking 2 days more to sell than last year.
Interestingly, New Business Jet shipments as reported by GAMA increased by 12.5 percent, from 281 to 316, in the first six months of 2019 compared to 2018. However, New Business Turboprops declined by 11.2 percent, or 29, in the same comparative periods.
Comparing June 2019 to June 2018, turbine helicopters saw a double-digit decrease in YTD Sale Transactions, down 13.3 percent, while piston helicopters showed a decline of 2.6 percent.
Commercial airliners are also reported by JETNET in Table A – Worldwide Trends, and include the number for sale for both commercial jets (including airliners converted to VIP) and commercial turboprops. Commercial jets and commercial turboprops were down in full sale transactions, at 19.6 percent and 30.1 percent respectively, in the YTD June-over-June comparisons.
For the first six months of 2019 there were a total of 4,270 aircraft and helicopters sold, with business jets (1,122) and commercial jets (874) leading all types and accounting for 47 percent of the total. The number of retail sale transactions across all market sectors—at 4,270—decreased by 874, or 17 percent, compared to the first six months of 2018. The piston models that JETNET tracks are: Baron 58 series, Cessna 421 series, Diamond DA62, and the Piper high-end singles M350, Malibu, Matrix, and Mirage.
Global, USA, and Non-USA Pre-Owned Market Trends
Highlighted in Table B are business jets and business turboprops, comparing the months of June from 2012 to 2019 (seven years) for the USA vs. Non-USA aircraft in operation, for sale, and percentage for sale.
The general trend has been that growth in business jets has out-paced turboprops in the last seven years. Since June 2012, 3,545 new business jets have joined the global fleet, as compared to 2,193 turboprops.
The number for sale and percentage for sale have declined since 2012. The split between USA vs. Non-USA for business jets in operation has remained at 60/40 levels, whereas the business turboprops split of in-operation USA vs. Non-USA is about 51/49. Interestingly, the number for sale in the USA vs. Non-USA is 61/39 for business jets and 58/42 for business turboprops. Currently, for sale business jets exceeded the 2,000 mark after a steady decline since 2016.
Pre-Owned Business Jet Transactions
Chart A displays the 12-month moving average for full retail transactions for business jets from Dec. 2011 to June 2019.
From Dec. 2011, used business jet transactions steadily increased until June 2016 to a high point of 2,725. A falling-off occurred in the second half of 2016 to a low point of 2,522 in Dec. 2016, and has since steadily increased to 2,892 transactions in December 2018. However, starting in January 2019, the 12-month moving average for full retail transactions for business jets has declined to 2,584, or 21.5 percent.
This decline is only slightly above the low point of 2,522 full sale transactions recorded in December 2016.


